

Compare Vehicles With
Confidence & Clarity
Side-by-side NHTSA crash test ratings, recall history, EPA efficiency, and 5-year cost forecasts—structured into clear visual intelligence before you buy.
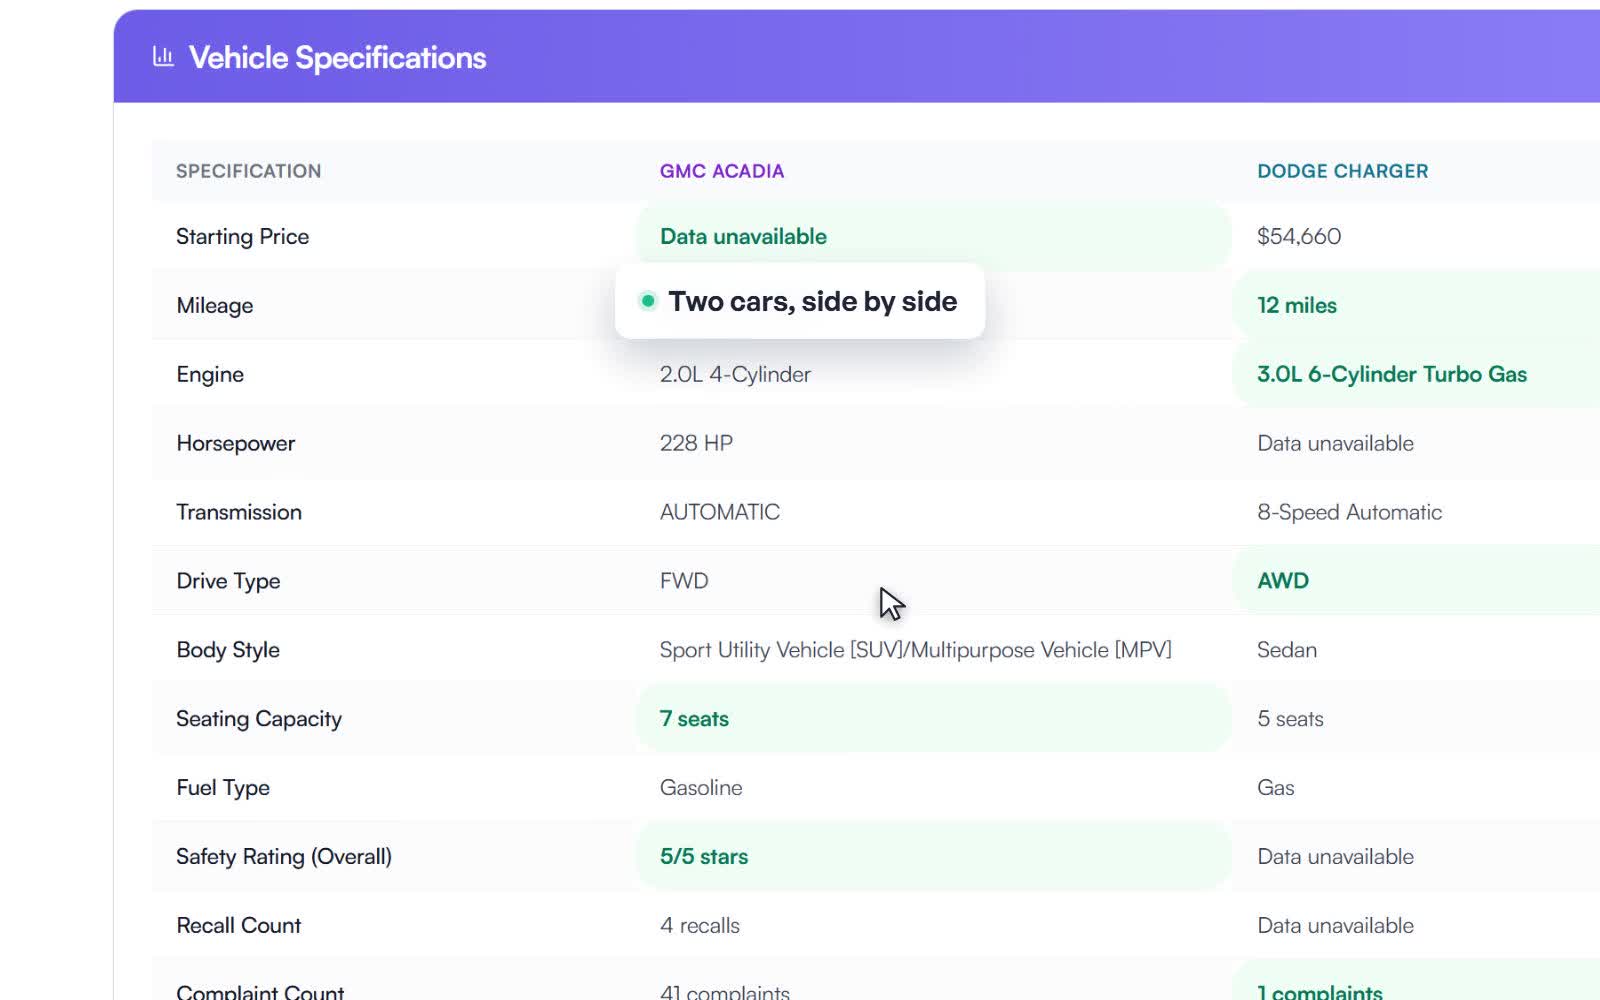
Side by side
Two cars, every spec compared
Price, engine, drivetrain, capacity and more, lined up field by field so the differences are obvious at a glance.
- Every spec, one to one
- Real numbers, not brochure copy
- The gaps a dealer glosses over
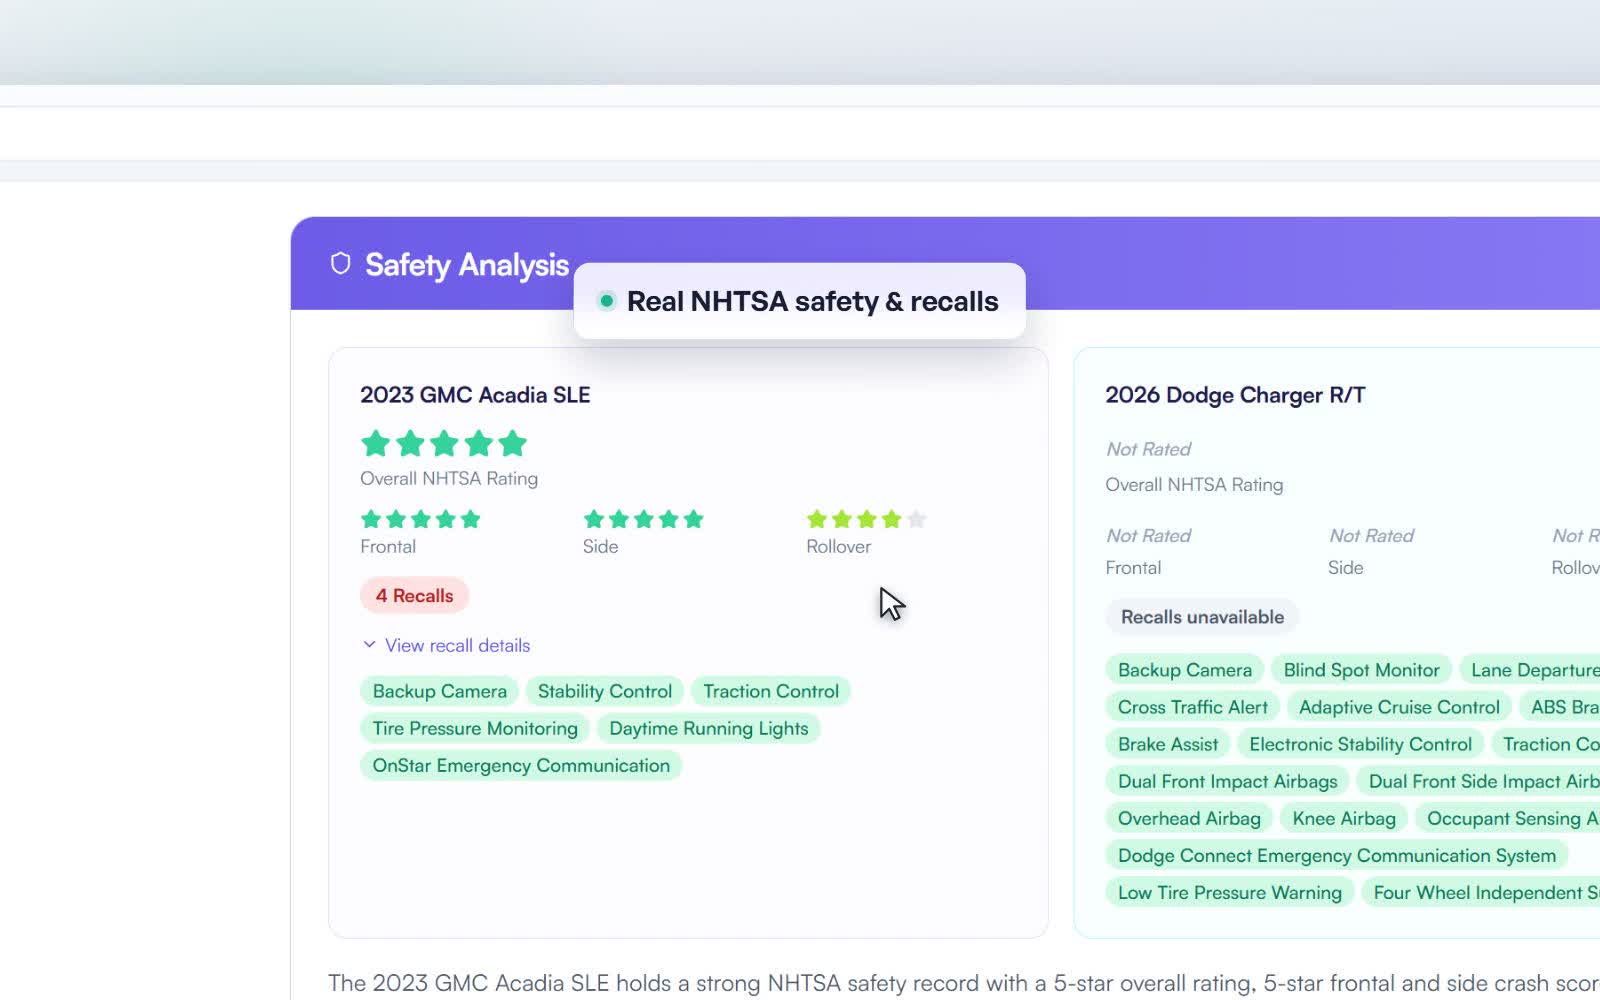
Safety
Real NHTSA safety and open recalls
Five star crash ratings and live recall campaigns, pulled straight from NHTSA. Not a paywalled history summary.
- Frontal, side and rollover ratings
- Open recall campaigns flagged
- Straight from NHTSA, live
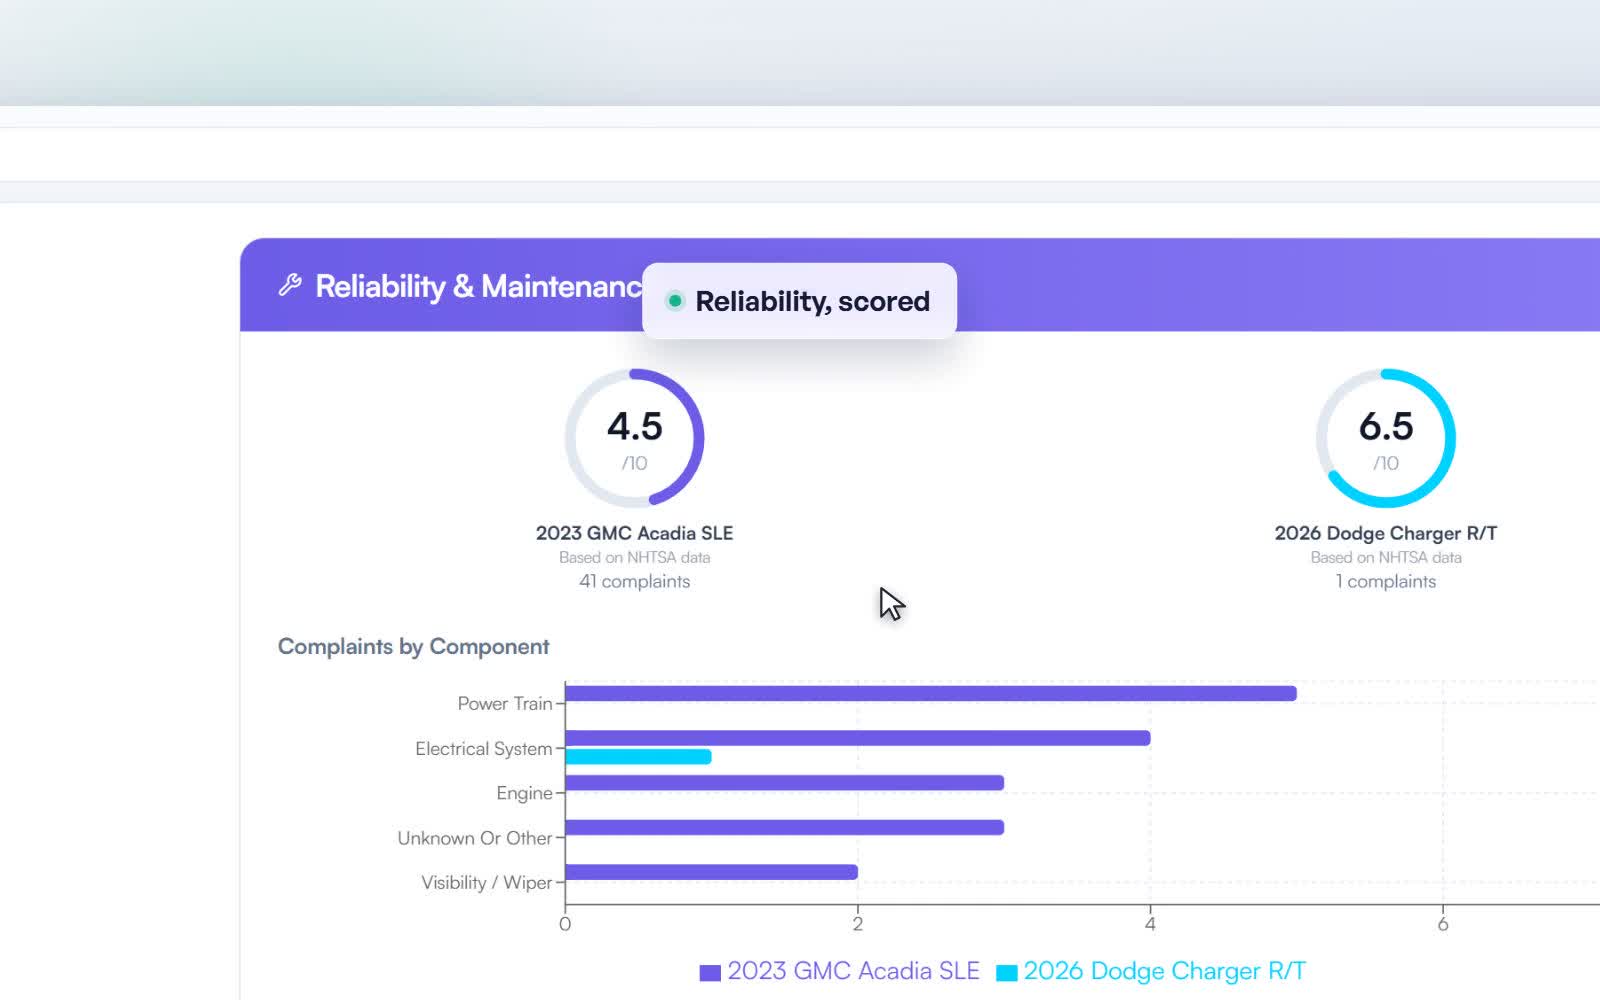
Reliability
Reliability, scored, not guessed
Complaint patterns by component and an overall reliability score, so you know what tends to break before you buy.
- An overall reliability score
- Complaints broken down by component
- What to expect over the years
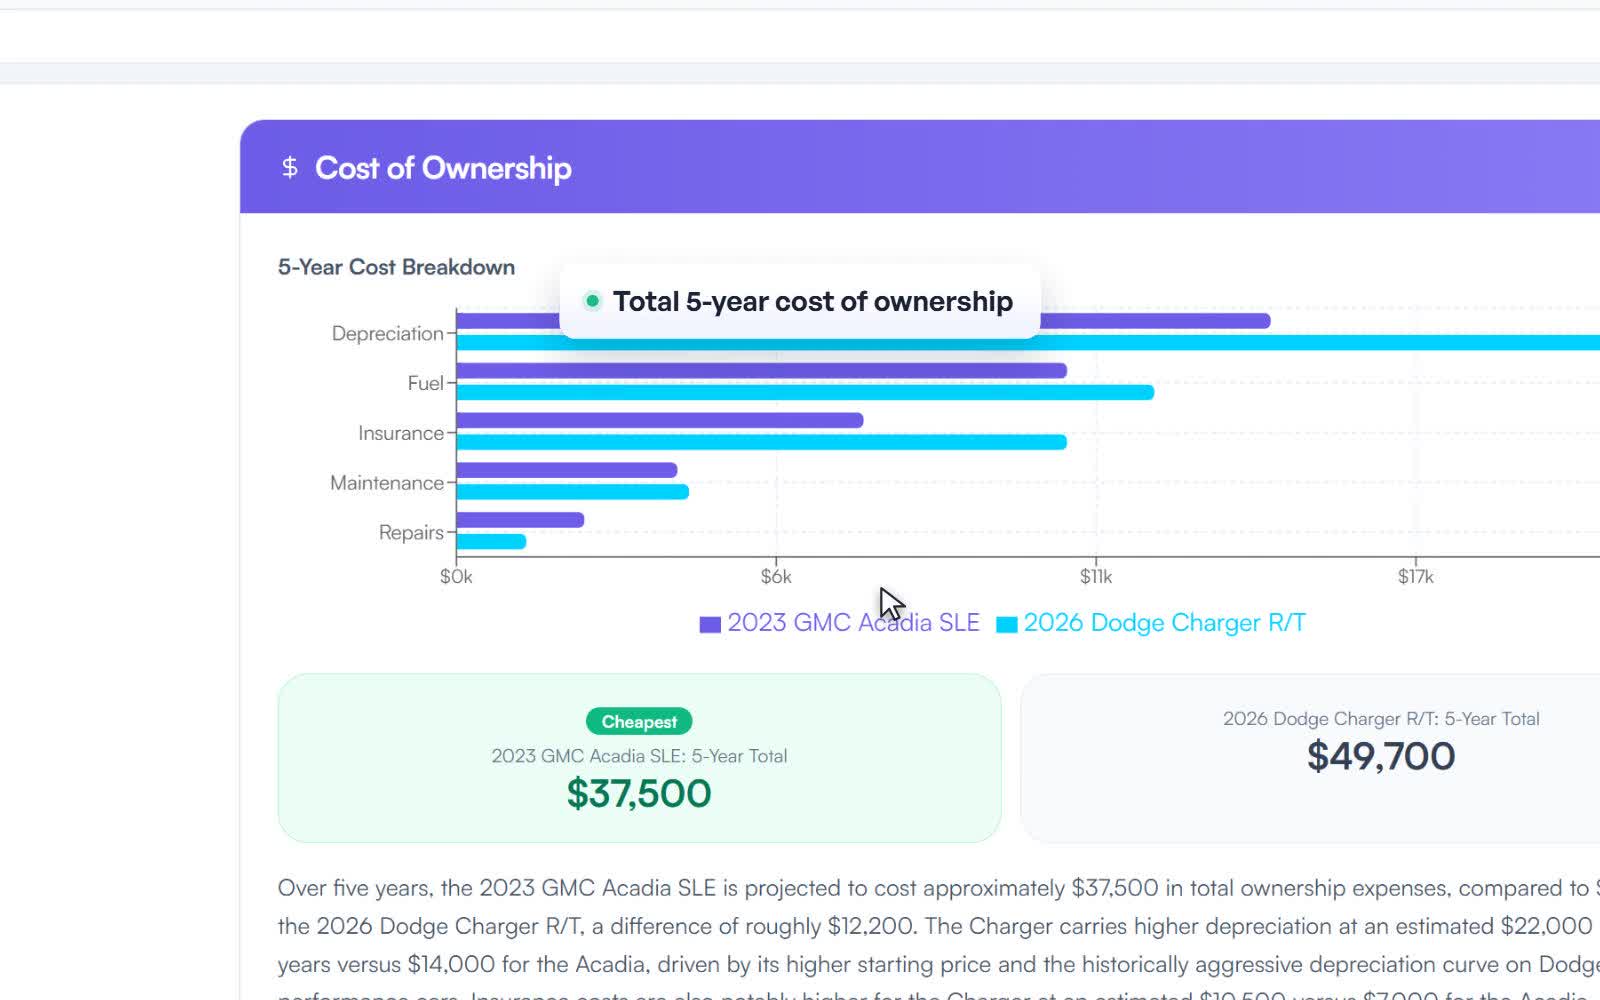
True cost
The full five year cost, not the sticker
Depreciation, fuel or charging, insurance and scheduled service, added up so the cheaper sticker is not always the cheaper car.
- Five year total cost of ownership
- Depreciation, fuel, insurance, service
- Which one is actually cheaper
Resale
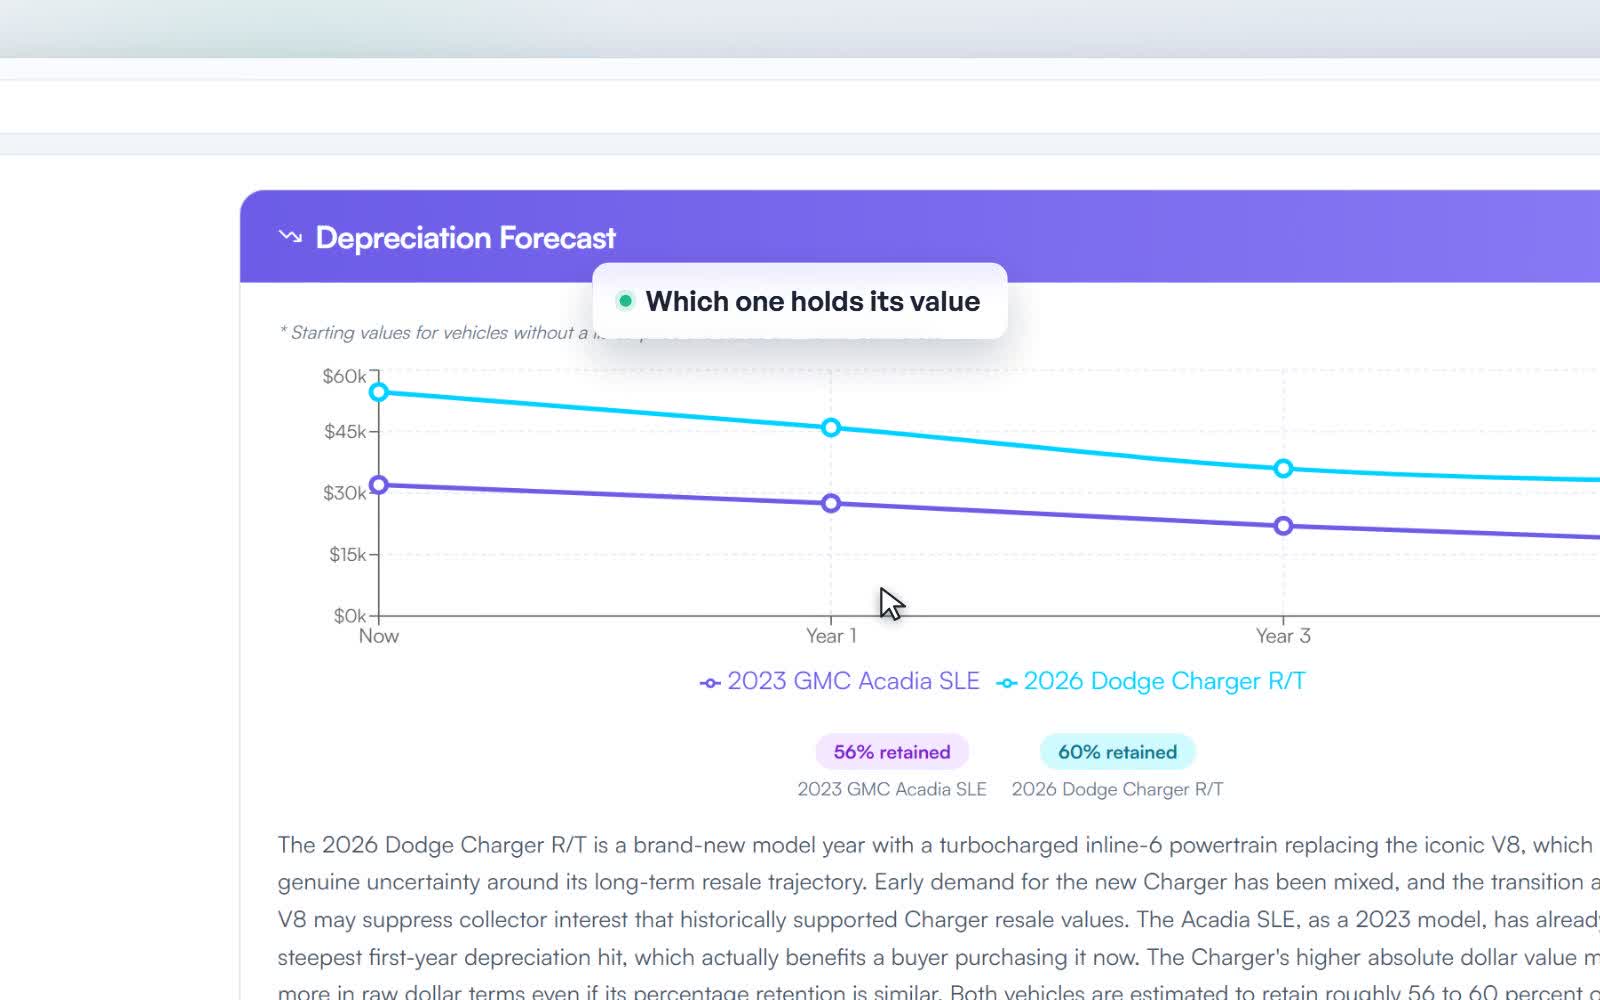
Which one holds its value
A depreciation forecast and resale retention for each vehicle, so you know which one is worth more when you sell.
- A five year depreciation curve
- Resale retention compared
- The better long term asset
The verdict
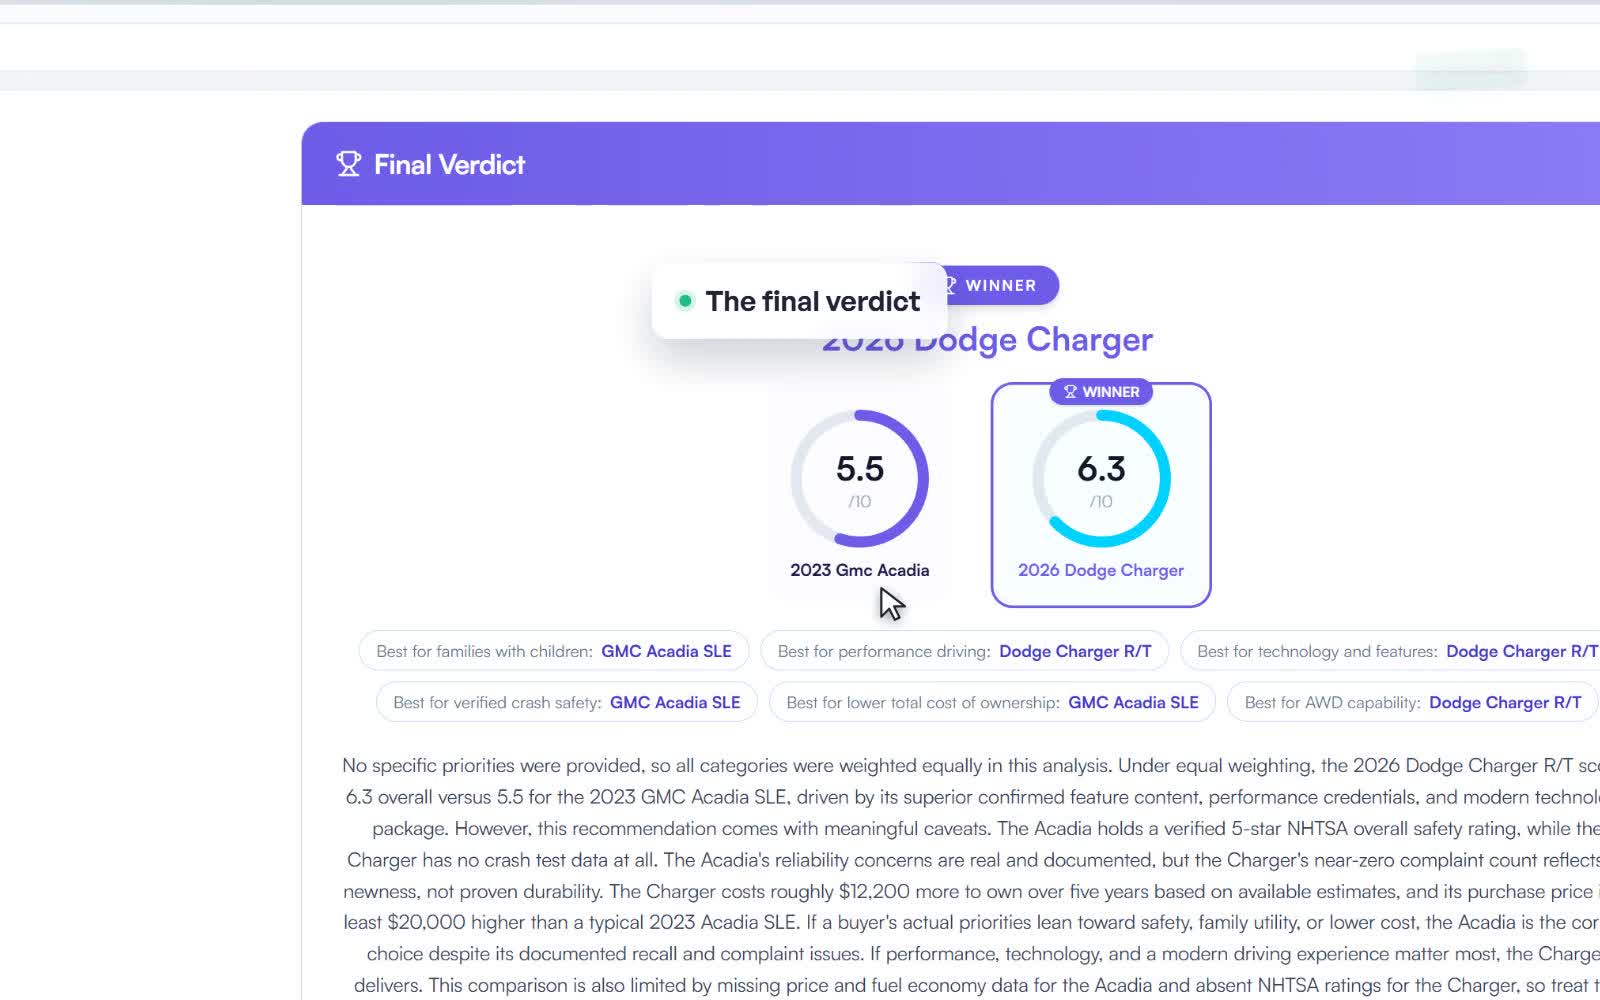
The final verdict, and why
rivval names the better buy across safety, reliability, cost and value, and shows the reasoning behind the pick.
- A clear winner with a confidence score
- Category winners across the board
- The reasons that decided it